FiberLink models GPON, FTTH and point-to-point topology as a live graph, calculates the optical loss budget in dBm as you add every splice, splitter and span — then checks what your power meter actually reads against it, node by node.
New in v1.1 — field diagnosis. FiberLink now checks the network you built against the one you measured. Log what the meter reads at any node for an instant pass, marginal or fail verdict, judged on drift from the design and against the receiver window separately. GPON Class B+/C+ presets or your own criteria, optional GPS tags per reading, and the measured column carried through to the PDF. How the diagnosis works →
The FiberLink web app has been retired. Planning now lives entirely in the Android app, where the canvas, offline storage and PDF export all work in the field. Existing web projects are no longer served from this domain — rebuild them in the app, or email us and we'll help you move them over.
Topology, loss budget and diagnosis in one canvas — on the device you already carry to site. No spreadsheet, no desktop licence.
Tap to add a headend, cabinet, splice, splitter or drop. The graph lays itself out as the network grows — GPON trees, FTTH distribution or straight point-to-point runs.
Every node recalculates instantly: fiber attenuation per km, connector and splice loss, splitter ratio. Power at each point in dBm, not an estimate at the end.
Open any node to see the subtraction line by line — upstream power, cable loss over the span, connector loss, split ratio. Auditable numbers you can defend on a review call.
Log what the power meter reads at any node and get the verdict as you type — pass, marginal or fail. A custom in-app keypad means no fighting the OS keyboard in the cold.
Presets for GPON Class B+ and C+ using the ITU-T G.984.2 receiver windows, a tighter field target, or your own window and tolerance — with a live preview before you commit.
Tag any reading with a GPS fix, opt-in and one tap at a time, then open that node straight in Google Maps. The next crew finds the exact chamber, not the general area.
Export topology, loss table and — where you logged them — the measured value, status and location per node, plus the criteria used. Hand it to the client, the contractor or the as-built file without redrawing anything.
Networks are stored on the device. Plan in a basement, a duct chamber or a village with no bars, and the numbers still update.
Work in kilometers, miles or feet. Switch units in settings and every span, budget and report follows — no manual conversion.
Create a network, name it, and enter transmitter output in dBm. That single number anchors the whole budget.
Add cabinets, splices and splitters. Give each span its length and each joint its loss — the graph propagates power downstream as you go.
On site, log what the meter reads at each node. FiberLink judges it against the design and against the receiver window, and flags the ones that miss.
Fix the ratios that go under budget, then export a PDF carrying the design, the measured column and the criteria you judged against.
High-contrast dark canvas, large hit targets, and readable numbers when you're standing at the cabinet.
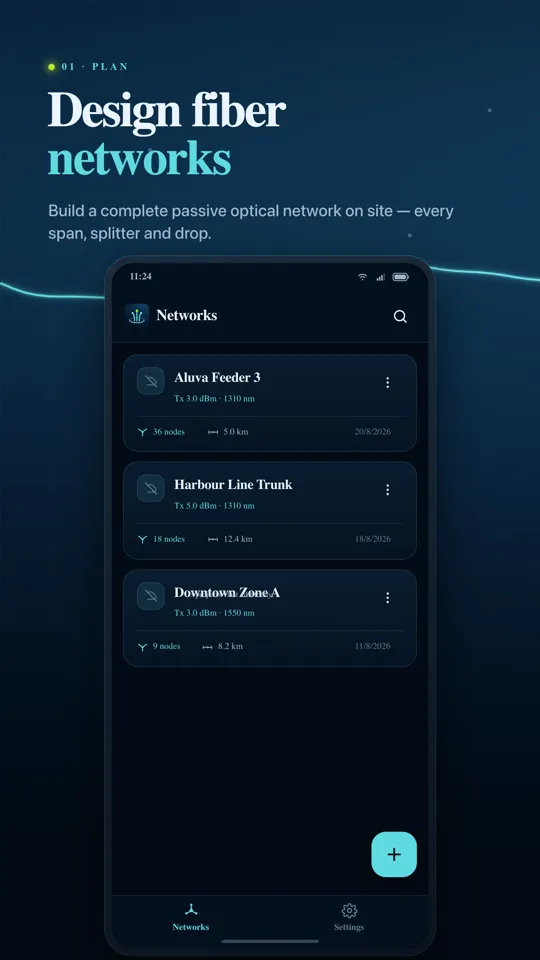
Build a complete passive optical network on site — every span, splitter and drop.
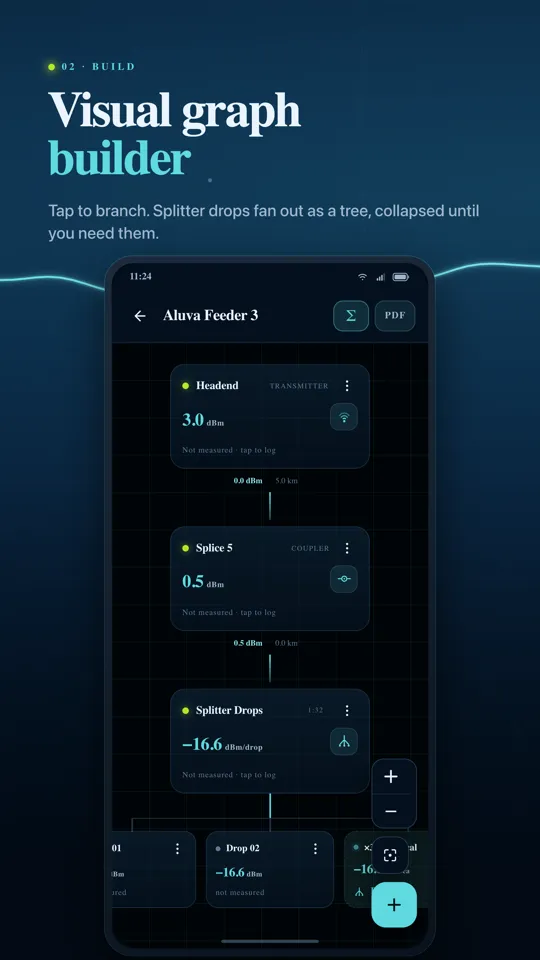
Tap to branch. Splitter drops fan out as a tree, collapsed until you need them.
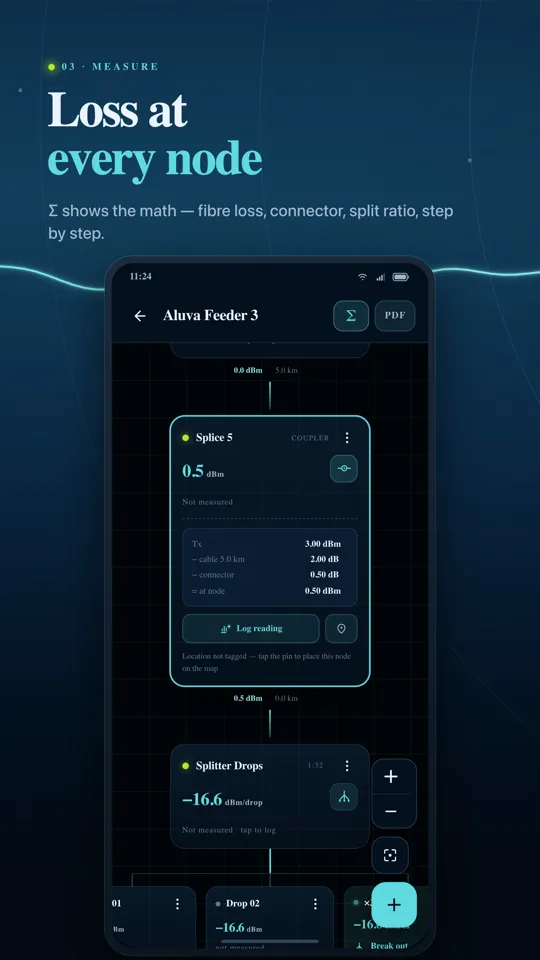
Σ shows the math — fiber loss, connector, split ratio, step by step.
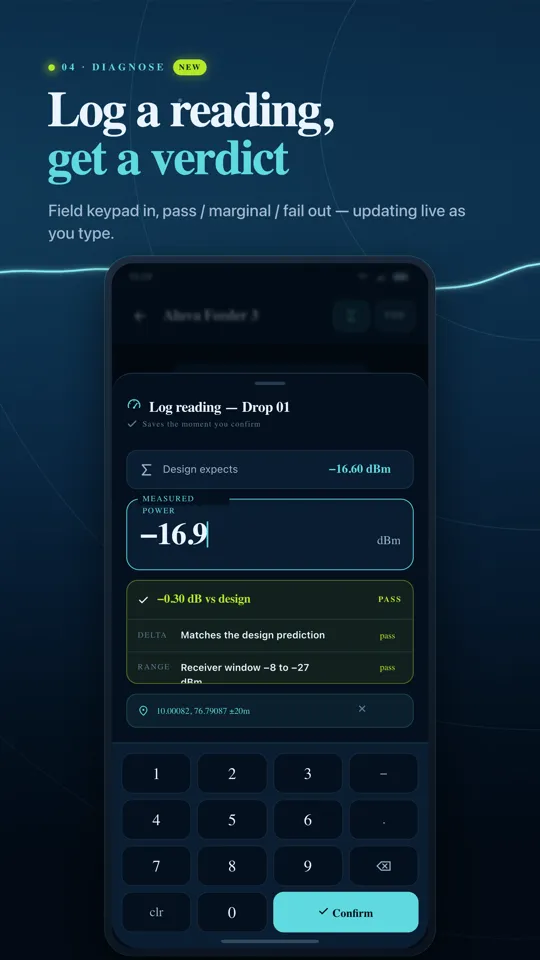
Field keypad in, pass / marginal / fail out — updating live as you type.
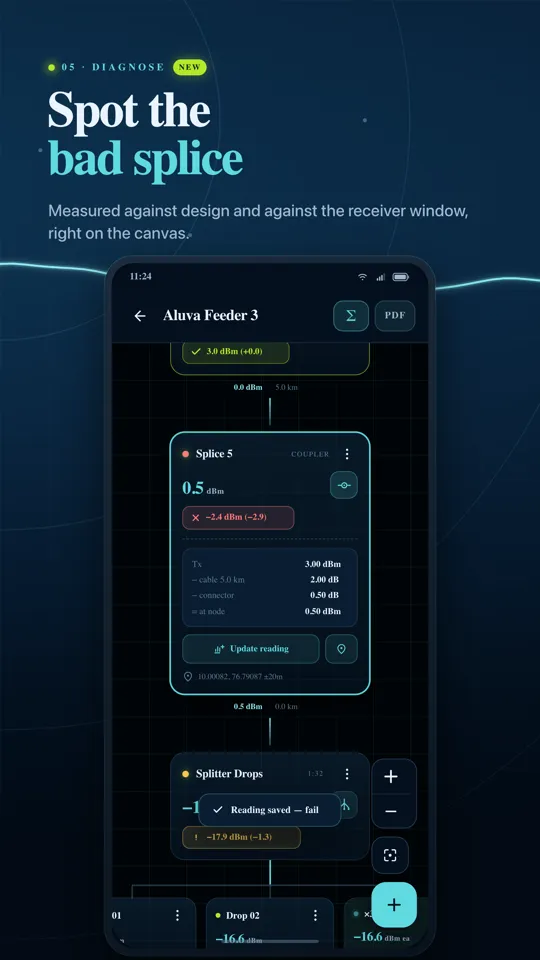
Measured against design and against the receiver window, right on the canvas.
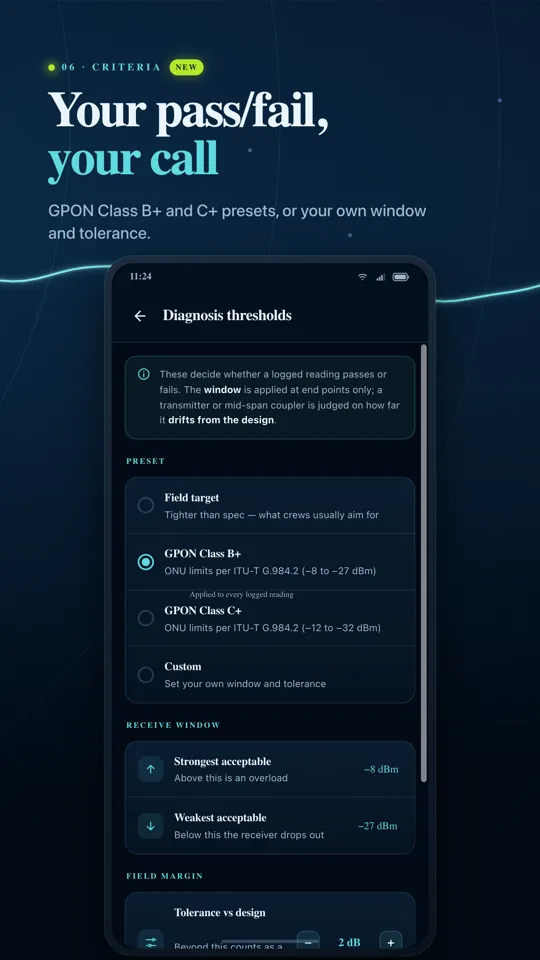
GPON Class B+ and C+ presets, or your own window and tolerance.
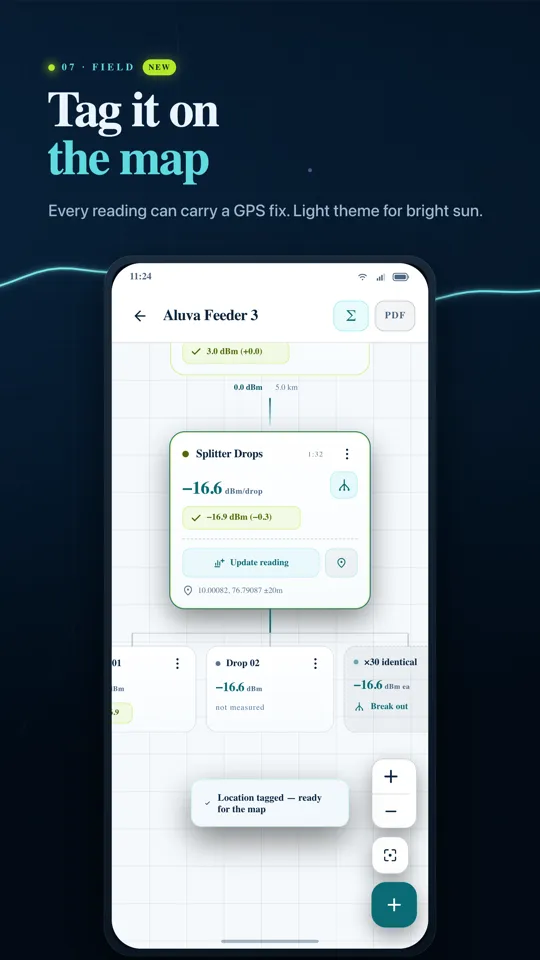
Every reading can carry a GPS fix. Light theme for bright sun.
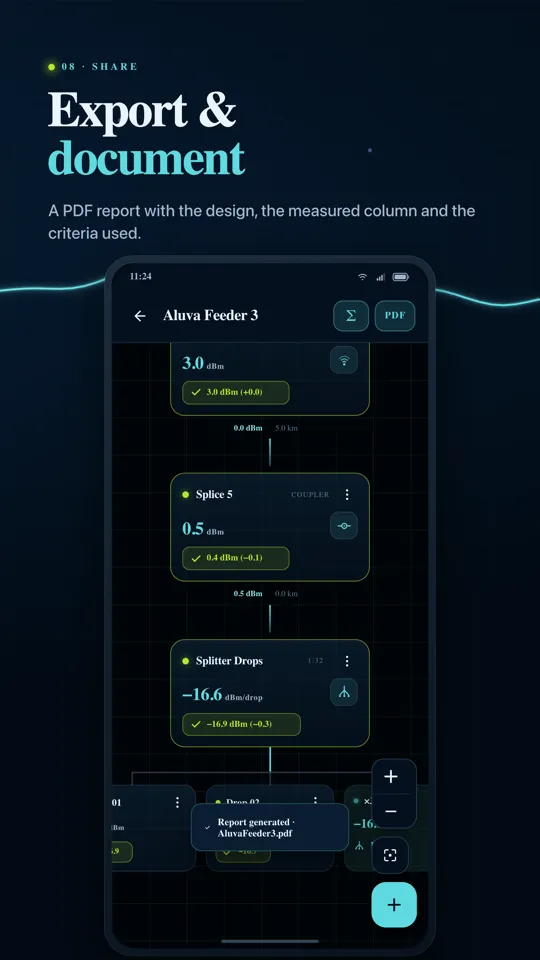
A PDF report with the design, the measured column and the criteria used.
Short practical guides on loss budgets, topologies, splitter maths and field diagnosis — the questions we get asked most.
Delta finds faults, range finds planning mistakes. How to tell which one just failed — and which tool to pick up next.
Guide · 6 minB+ runs −8 to −27 dBm, C+ runs −12 to −32 dBm. Why C+ reaches further but overloads sooner.
Guide · 7 minThe full subtraction, from transmitter output to ONT sensitivity — with a worked 8.2 km example.
Guide · 6 minWhy splitting is the biggest line in your budget, and how to place ratios so every drop still closes.
Guide · 8 minHow subscriber density, distance and future capacity decide the architecture before you draw a node.
Yes. The planner, the loss calculations, the diagnosis features and PDF export are all free on Google Play. No account, no sign-in, and your networks are never uploaded anywhere.
Both. Log what your power meter actually reads at any node and FiberLink compares it against the design on the spot, returning pass, marginal or fail. It judges two things separately: delta, the drift from the predicted value, which points at an upstream fault like a bad splice or dirty connector; and range, whether the reading falls inside the receiver's working window, which points at a planning problem instead. Read the full explanation →
You choose the criteria. There are presets for GPON Class B+ (−8 to −27 dBm) and Class C+ (−12 to −32 dBm) using the ONU receiver limits from ITU-T G.984.2, a tighter Field Target preset, or a fully custom window and tolerance. A live preview shows how sample readings would be judged before you commit, and the criteria you used are printed in the exported PDF. More on the two classes →
No. FiberLink does not measure anything itself. Your meter tells you what the link does; FiberLink tells you what it should have been, and does the comparison for you at the node. You still need the instrument — you just no longer need to carry the design back to the office to find out whether the number was acceptable.
GPON and other PON trees with cascaded splitters, FTTH distribution layouts, and simple point-to-point links. Any topology you can express as a tree of nodes with spans, splices and split ratios.
Downstream power at a node is upstream power, minus fiber attenuation over the span length, minus connector and splice loss, minus the split ratio penalty. Every node shows that subtraction line by line so you can check it against your own figures.
Neither. Networks are stored on the device and every calculation runs locally, so it works in a basement, a duct chamber or a village with no signal. No sign-in is required.
Only when you explicitly tap to tag a reading. There is no background location and no continuous tracking, and the permission is not requested until that moment. The coordinate is saved into your local project alongside the reading and is not uploaded. See the privacy policy for the full detail.
Export the network as a multi-page PDF report: the topology, the loss table for every node, and where readings have been logged, the measured value, status and location alongside the design figure. Send it like any other document.
Not yet. Android only for now. If iOS matters to you, tell us at [email protected] — demand decides what we build next.
No. The browser-based planner has been retired and this domain now hosts the app site only. All development goes into the Android app, which works offline and exports PDF reports directly from the device.
Free on Google Play. Works offline. Exports a PDF you can hand over.
 FiberLink